Scratch Tutorials
Software Installation
KidsBlock Installation
Install Kidsblock on Windows System
You could download KidsBlock from:
Provided file:

After downloading, click “KidsBlock.exe”

Tick “Anyone who uses this computer(all users)” and then click “Next”.

Click “Browse…” to choose a path to install (Here we choose Disk C; you may select any where you like), and click “Install”. Now it is installing!


After installation completing, click “Finish” to open it.

If a warning shows up, please just click “Allow access” to enter the software main page.

Install Kidsblock on MacOS
Please download Kidsblock package first: http://xiazai.keyesrobot.cn/KidsBlock.dmg

Click KidsBlock and drag the K”idsBlock Desktop” into “Applications”, as shown below.

After installation, the KidsBlock icon will show in operating pad:

Click the KidsBlock icon to enter the software. If it fails, please modify some computer settings to re-enter it. This is because Mac Systems, by default, only authorize the installation in App Store, so others is not allowed to be installed.

Open the settings, and click Privacy and Security. Switch the security option to “App Store and Approved Developers”, and click “Still Open”.

Click “Open” to re-enter the blocked software.

After settings, it can work normally.

The startup interface is as below. Now enjoy your journey of programming!

Software Guidance
(Following demonstrations are based on Windows System, and is only a reference for MacOS.)
Main Page Function Distribution 1

Select Language
Click  to select “English” or “简体中文”
Install Driver
NOTE: If your computer has already installed a driver, please just skip this section. If not, please follow these steps.
Click
 to select “Install driver”.

Click “Next” when you see the device driver installation wizard:

Click “Finish”.

Click “Next”.

Click “Finish”.

If a warning pops up, just click “Allow”. Then click “Install”.

Tap “Finish”.

Click “Extract”.

Click “Next”.

Tick “I accept this agreement” and click “Next”.

Click “Finish”.

Choose “INSTALL”.

A couple of seconds later, the driver will be successfully installed. Then click “OK”.

Select Devices
Choose a device and a serial port
Click
 to choose a device.
Here we enter Kit to find Smart farm for ESP32 and add it. Note that all sensors are included in this kit, so you do not need to import them additionally.

After import this kit, you will see the following interface of port selecting. Click Connect at the correct port.

Tap Go to Editor.

Main Page:

Disconnect the device
If you want to disconnect the kit and port, please click
 .
.Then tap Disconnect to unbind the current connection.

Main Page Function Distribution 2

Expand a Sensor/Module
NOTE: This part can be SKIPPED, as all required sensors are integrated in the kit with no need to expand. If you want to adopt an excluded module, please refer to the following procedures.
Click
 to enter the sensors/modules extension library.
Choose an extension.

For instance, a buzzer module is required, please click passive buzzer:

When “Not loaded” becomes “Loaded”, this module is successfully imported.

Click
 to back to the editor. Now you will find that a Passive buzzer block appears in Code.

If you want to remove the “Passive buzzer”, just click
 to enter library and tap.
When “Loaded” shifts to “Not loaded”, this module is successfully deleted.
Import File
Method 1
If the software is not in operation, then directly click SB3 file to open it. For example, click
 to open it. Remember to select a device.
Method 2
Open Kidsblock. Click “file” to choose “Load from your computer”.

Select an SB3 file (like
).
Import successfully!
Upload Code & Set Baud Rate
Upload code
Upload file
to Kidsblock.Connect the development board to your computer (If the you cannot see a port, please install a driver first), and select the correct port and click
 .
.Wait for uploading.

Set Baud rate
If there is not a print box, please click one of
 to adjust the box size.
Small print box

Large print box

No print box

Click
 to set the corresponding baud rate.

“Hello KidsBlock” starts to be printed in the box after setting.

Assembling
During assembling, some codes are required to be burned, so please install software first.
The whole assembling generally can be divided into two parts: assembling parts and wirings.
Step 1
1.1 Required components

1.2

1.3

1.4

1.5

Step 2
2.1 Required components

2.2
Assemble the wooden board X and O on bottom plate H

2.3

2.4

2.5

2.6

2.7

2.8 Wiring
Module |
Wire |
Pin |
|---|---|---|
Relay Module |
3PIN 20cm |
IO25 |
Pay attention to the color of the Dupont wire: For the relay module, connect yellow to S, red to V, black to G.

2.9

Step 3
3.1 Required components

3.2

3.3

3.4

3.5

3.6

3.7

3.8

3.9

3.10

3.11

Step 4
4.1 Required components

4.2 Set Servo to 180°
Before mount the servo, firstly please set the angle to 180° by programming: Arduino(C++) or Scratch(Graphical programming).
Please refer to the software installation steps for details.
Connect Servo to ESP32 development board at pin IO26.


Open Scratch 3.0. Select ESP32 board and the correct serial port, and burn the following code to the board.

After setting the servo to a specific angle, disconnect the it from the development board for installation.
4.3 Install Servo

4.4

4.5

4.6

4.7

4.8

4.9
NOTE: When installing the lid of the feeding box, its opening should be fully closed.

4.10

4.11

4.12

Step 5
5.1 Required components

5.2

5.3

5.4

5.5 Prototype

5.6 Wiring
Connect modules via Dupont wires.
Module |
Wire |
|---|---|
Temperature and Humidity Sensor |
3PIN 20cm |
LCD 1602 |
4PIN (Black-Red-Blue-Green) |
Pay attention to the color of the Dupont wire:
For temperature and humidity sensor, connect yellow to S, red to V, black to G.

5.7
For the LCD display, connect green to SCL, blue to SDA, red to VCC, black to GND.

Step 6
6.1 Required components

6.2

6.3

6.4 Wiring
Module |
Wire |
|---|---|
Ultrasonic module |
4PIN (Black-Green-Blue-Red) |
Pay attention to the color of the Dupont wire: For the ultrasonic module, connect blue to TRIG,green to ECHO, red to VCC, black to GND.

Step 7
7.1 Required components

7.2

7.3

7.4 Wiring
Connect modules via Dupont wires.
Module |
Wire |
|---|---|
PIR Motion Sensor |
3PIN 15cm |
Button Module |
3PIN 15cm |
Pay attention to the color of the Dupont wire: Connect yellow to S, red to V, black to G.

Step 8
8.1 Required components

8.2

8.3

8.4

8.5

8.6

8.7

8.8 Prototype

8.9 Wiring
Module |
Wire |
|---|---|
Fan |
4PIN (Black-Red-Blue-Green) |
Steam Sensor |
3PIN 15cm |
Photoresistor |
3PIN 15cm |
Pay attention to the color of the Dupont wire: Connect yellow to S, red to V, black to G, blue to IN+, green to IN-.

Step 9
9.1 Required components

9.2

9.3

9.4 Wiring

Step 10
10.1 Required components

10.2

10.3

10.4 Bottom View

10.5

10.6

10.7

Step 11 Wiring
11.1
Pay attention to the color of the Dupont wire: Connect yellow to S, red to V, black to G.
NO. |
Components |
Wires |
ESP32 Board Pins |
|---|---|---|---|
1 |
Fan |
4pin, Divided Black-Red-Blue-Green |
io18(IN-) | io19(IN+) |
2 |
PIR Motion Sensor |
3pin 15cm |
io23 |
3 |
Button |
3pin 15cm |
io5 |
4 |
Ultrasonic Module |
4pin,Divided Black-Green-Blue-Red |
D12(TRIG) D13(ECHO) |
5 |
LCD 1602 |
4pin, Connected |
I2C |
6 |
Temperature and Humidity Sensor |
3pin 20cm |
io17 |
7 |
Steam Sensor |
3pin 15cm |
io35 |
8 |
Photoresistor |
3pin 15cm |
io34 |
9 |
Servo |
– |
io26 |
10 |
Buzzer |
3pin 20cm |
io16 |
11 |
LED |
3pin 20cm |
io27 |
12 |
Water Level Sensor |
3pin 25cm |
io33 |
13 |
Soil Humidity Sensor |
3pin 20cm |
io32 |
14 |
Water Pump |
3pin 20cm |
io25 |
11.2 Fan
Components |
Wire |
ESP32 Board Pins |
|---|---|---|
Fan |
4PIN Divided (Black-Red-Blue-Green) |
io18(IN-), io19(IN+) |
Module Pin |
Wire Color |
|---|---|
IN- |
GREEN |
IN+ |
BLUE |
V |
RED |
G |
BLACK |

11.3 PIR Motion Sensor
Component |
Wire |
ESP32 Board Pin |
|---|---|---|
PIR Motion Sensor |
3PIN 15cm |
io23 |
Connect red to V, black to G, yellow to S.
Module Pin |
Wire Color |
|---|---|
V |
RED |
G |
BLACK |
S |
YELLOW |

11.4 Button Module
Component |
Wire |
ESP32 Board Pin |
|---|---|---|
Button |
3PIN 15cm |
io5 |
Connect red to V, black to G, yellow to S.
Module Pin |
Wire Color |
|---|---|
V |
RED |
G |
BLACK |
S |
YELLOW |

11.5 Ultrasonic Module
Component |
Wire |
ESP32 Board Pins |
|---|---|---|
Ultrasonic Module |
4PIN Divided (Black-Green-Blue-Red) |
io13(ECHO), io12(TRIG) |
Connect red to V, black to G, blue to io12, green to io13.
Module Pin |
Wire Color |
|---|---|
V |
RED |
G |
BLACK |
ECHO |
GREEN |
TRIG |
BLUE |

11.6 LCD 1602
Component |
Wire |
ESP32 Board Pins |
|---|---|---|
LCD1602 |
4PIN Connected (Black-Red-Blue-Green) |
I2C |
Connect red to V, black to G, blue to SDA, green to SCL.
Module Pin |
Wire Color |
|---|---|
V |
RED |
G |
BLACK |
SCL |
GREEN |
SDA |
BLUE |

11.7 Temperature and Humidity Sensor
Component |
Wire |
ESP32 Board Pins |
|---|---|---|
Temperature and Humidity Sensor |
3PIN 20cm |
io17 |
Connect red to V, black to G, yellow to io17.
Module Pin |
Wire Color |
|---|---|
V |
RED |
G |
BLACK |
S |
YELLOW |

11.8 Steam Sensor
Component |
Wire |
ESP32 Board Pin |
|---|---|---|
Steam Sensor |
3PIN 15cm |
io35 |
Connect red to V, black to G, yellow to io35.
Module Pin |
Wire Color |
|---|---|
V |
RED |
G |
BLACK |
S |
YELLOW |

11.9 Photoresistor
Component |
Wire |
ESP32 Board Pin |
|---|---|---|
Photoresistor |
3PIN 15cm |
io34 |
Connect red to V, black to G, yellow to io34.
Module Pin |
Wire Color |
|---|---|
V |
RED |
G |
BLACK |
S |
YELLOW |

11.10 Servo
Pass the wire of Servo through the Hole 15, and then connect it to ESP32 board.
Component |
Wire |
ESP32 Board Pin |
|---|---|---|
Servo |
3PIN |
io26 |
Connect red to V, black to G, yellow to io26.
Board Pin |
Wire Color |
|---|---|
V |
RED |
G |
BLACK |
IO26 |
YELLOW |

11.11 Buzzer
Pass the wire of Buzzer through the Hole 17, and then connect it to ESP32 board.
Component |
Wire |
ESP32 Board Pin |
|---|---|---|
Buzzer |
3PIN 20cm |
io16 |
Connect red to V, black to G, yellow to io16.
Module Pin |
Wire Color |
|---|---|
V |
RED |
G |
BLACK |
S |
YELLOW |

11.12 LED
Pass the wire of LED through the Hole 7, and then connect it to ESP32 board.
Component |
Wire |
ESP32 Board Pin |
|---|---|---|
LED |
3PIN 20cm |
io27 |
Connect red to V, black to G, yellow to io27.
Module Pin |
Wire Color |
|---|---|
V |
RED |
G |
BLACK |
S |
YELLOW |

11.13 Water Lever Sensor
Pass the wire of water level sensor through the Hole 13, and then connect it to ESP32 board.
Component |
Wire |
ESP32 Board Pin |
|---|---|---|
Water Lever Sensor |
3PIN 25cm |
io33 |
Connect red to V, black to G, yellow to io33.
Module Pin |
Wire Color |
|---|---|
V |
RED |
G |
BLACK |
S |
YELLOW |

11.14 Soil Humidity Sensor
Pass the wire of soil humidity sensor through the Hole 11, and then connect it to ESP32 board.
Component |
Wire |
ESP32 Board Pin |
|---|---|---|
Soil Humidity Sensor |
3PIN 20cm |
io32 |
Connect red to V, black to G, yellow to io32.
Module Pin |
Wire Color |
|---|---|
V |
RED |
G |
BLACK |
S |
YELLOW |

11.15 Relay Module
Component |
Wire |
ESP32 Board Pin |
|---|---|---|
Relay Module |
3PIN |
io25 |
Pass the wire of Water Pump through the Hole 11 in the way as shown below:

Connect red to V, black to G, yellow to io25.
Module Pin |
Wire Color |
|---|---|
V |
RED |
G |
BLACK |
S |
YELLOW |

11.16

Step 12
12.1 Required components

12.2

12.3

12.4

12.5

Step 13
13.1 Required components

13.2

13.3

Step 14
14.1 Required components

14.2

14.3

14.4

14.5

14.6

14.7

Step 15
15.1 Required components

15.2

15.3

15.4

Step 16
16.1 Required components

16.2

16.3

16.4

Step 17
17.1 Required components

17.2

17.3

Step 18
18.1

18.2

18.3

18.4

18.5

18.6

18.7

18.8

18.9

18.10

Step 19
19.1

19.2

19.3

Projects
Project 1: Lighting System
Let’s start our first project, lighting system.
Lighting up an LED is one of the most fundamental Arduino practice.
This start-up lesson is designed for beginners to understand hardware and software programming on ESP32 development board and to master basic circuit and programming knowledge.

Therefore, our tutorial guidance is simple. And this intriguing project can be applied in actual scenarios at home or in office.
In this project, you will have learned the basic connections and settings of the ESP32 development board in the Arduino programming. What’s more, some functions will also be presented for you, such as lighting on/off an LED via the output level of a digital pin or by a button.
All in all, this is an entry-level tutorial to lay the foundation for subsequent Arduino practices.
Flow Diagram

Light up an LED
Description
LED, short for Light Emitting Diode, is a solid-state semiconductor that converts electrical energy into visible light, so it is also called solid-state lighting.
When current passes through an LED, it light up.
Various LED:

LED module is a device to output, whose brightness and blinks can be controlled. For how to use, you only need to directly plug it into digital output pins on the development board.

Working principle:
When S is at a high level, Q1 triode is into conduction, and VCC voltage passes through LED to light up it.

Parameters:
Voltage: 3~5V
Current: ≤1.5mA
Power: 0.07W
Wiring Diagram
Connect the LED module to io27.
Attention: Connect yellow to S(Signal), red to V(Power), and black to GND. Do not reverse them!

Test Code
Open Kidsblock and choose the correct device and port.

Drag
 from
from  to the code editing area. Code Blocks execute only when they are in this area.
With this block, when booting the development board, code will run.
In
 , drag “forever” and paste it below the previous block. Block “forever” indicates a loop.
Drag an “LED pin output” block from
 and paste it in “forever”. Set the pin to IO27 and output level to HIGH, so that the LED pin will continue to output high level.


Add a 1s delay. Duplicate the “LED pin output” block but set the output to LOW, and also add a delay. Then LED will light up and go off in circulation.

Test Result
LED blinks per second, because io27 on ESP32 board outputs high and low level alternatively every second. Besides, various interactive applications can also be realized via an LED, like breathing LED, water flow lights and flashing police light.
Power Level |
Result |
|---|---|
HIGH |
LED on |
LOW |
LED off |
Expansion: Breathing LED
Description
IO interfaces of MCU (arduino UNO, ESP32 and Raspberry Pi Pico) output only digital signals (high or low level). For instance, in previous experiment (light up an LED), the digital outputs are only HIGH(3.3V) and LOW(0V).
If MCU outputs a high level of 3.3V or a low level of 0V, the input voltage should be at 0~3.3V. Thus, PWM (Pulse Width Modulation) is needed to output different voltage value, which is called “analog output”.

Knowledge
What is PWM?
PWM contains three elements: Frequency(Hz), Period, Duty Cycle(%).
PWM Frequency (f): the times of signal changing from high to low and return to high within one second. Generally speaking, Frequency is the number of PWM Period in a second.
PWM Period (T): Period = 1 / Frequency (T=1/f, and 1 means 1 second). For instance: f = 50Hz, so T = 20ms, which implies there are 50 times of Period per second.
PWM Duty Cycle: the time ratio of HIGH to the whole Period. If Period = 10ms and 8ms is pulse width time, Low level occupies 2ms, so the Duty Cycle = 8/(8+2) = 80%.

Conclusion: At an appropriate signal frequency, PWM changes effective output voltage by changing the duty cycle in one period. In plain English, within a specified time, the more high level the IO port outputs, the greater PWM value is, and the lighter LED will be.

Test Code

Define a variable item and assign it to 0.

Drag a “forever” block and paste a “repeat” block in it. Set repeat times to 255.

Drag a “variable mode” block in “repeat” and set the mode to “++”, which means item will increase 1 after each execution.

Find the block to set PWM which is contained in
as shown below, so you only need to set corresponding pin and analog value to output PWM.
Set LED pin:

Set channel: (16 channels in total: including 0~15)

Set PWM output value to item, which will automatically add 1 from 0 to 255. PWM output is 0~255, so we set the repeat times to 255.

Add a delay to 0.01s, so that LED will light up gradually rather than all of a sudden.

Duplicate the “repeat” block as follows, but set mode to “--”, which decreases variable item each time. And LED will dim gradually.

Test Result
LED lights up and dims gradually; it breathes evenly.

A Button
Description
Button Module is a device to input. MCU reads its power level to detect whether the button is pressed.

Schematic Diagram:

Parameters:
Voltage: 3~5V
Current: ≤1.1mA
Power: ≤5.5mW
The principle of the button module is a circuit controlled by this button.
When the button is pressed, the circuit is in closed state so that current passes through the button to GND, which causes the digital input pin to detect a low level.
When the button is released, the circuit is cut and pin level increases due to a pull-up resistor, which makes the digital pin to detect a high level.
Wiring Diagram
Connect the button module to io5
Attention: Connect yellow to S(Signal), red to V(Power), and black to GND. Do not reverse them!

Test Code
Initialize the serial port first of all, and set baud rate to 115200.

Set pin to IO5 and mode to input. What follows it is a “forever” block.

Read the power level of digital pin 5. If it is 1, print 1. Or else, print 0.

Complete code:

Test Result
Open serial monitor and set the corresponding baud rate.
When the button is released, the value is 1; if you press the button, it becomes 0.

In Scratch, we can read the state of the digital input pin by programming to detect whether the button is pressed. Thus, loads of interactive applications can be realized via a button module, such as LED on/off and display brightness adjustment.
Expansion: Auto-locking Button
An auto-locking button won’t pop up when you press it without holding, and it never pops up unless you press it again. It works like a switch. For regular buttons, such function can be realized via MCU and software.
Test Code
Define two variables: item as the read button value and button as the value shifted by button.

Assign the read button value to item.

Determine whether the button is pressed. If it is, shift the value of button and print it.

Delay 0.01s to eliminate the button jitter.
If a close state is detected at the button, a delay will be executed to eliminate Front Porch Jitter. Generally, the delay is within 5ms~10ms (Mechanical properties decide). After the jitter disappears, check the button state again. If the closed state level is still maintained, it is confirmed that there is a button pressed.
When a released button is detected, a delay of 5ms~10ms also should happen to remove the Back Porch Jitter, so that the program for the button can be executed.
When the button is pressed, button equals 1. Press it again, button shifts to 0, alternatively.
Complete code:

Test Result
Upload code and open the serial monitor.
When you press the button once, 1 will be displayed. If you press button for the second time, the value becomes 0. Now, a common button boasts the function of an auto-locking one.

Lighting Control
Description
In above basic experiments, we remould an auto-locking button to control the LED. An auto-locking button is suitable for any situations where a certain state needs to be maintained, for example, when LED needs to light up for a long time, the ESP32 development board is required for some operations.
In this experiment, we will adopt Arduino ESP32 board to guide you to implement a lighting system and simulate real-life scenes to control light via the button.
Wiring Diagram
Connect the button to io5 and LED to io27
Attention: Connect yellow to S(Signal), red to V(Power), and black to GND. Do not reverse them!

Test Code
Code Flow:

Complete code:
Based on the code for Auto-locking Button, we add “LED pin output” blocks.

Test Result
When you press the button once, LED lights up; if you press again, LED turns off. This operation is a loop, which is consistent with the lighting principle in reality.
In this chapter, we have demonstrated how to program and control via Scratch, and we have learned the basics as well as some software and hardware concepts in experiments such as auto-locking button and lighting control system.
These are essential for a good Scratch developer. Next, we will guide you to keep exploring more applications and skills, whether you are a beginner or a veteran. Hope you enjoy the fun and challenges during learning Scratch. Let’s move on!
FAQ
Q: LED doesn’t light up after uploading code.
A: Please check whether the pin defined in code is consistent with that in your wirings. If they are incompatible, please adjust it referring to the code.
Project 2: Light Control System
In this project, we will construct a light control system by a photoresistor and an LED. It is an intelligent system to adjust light, which saves energy and enhance efficiency as well.

This system is compatible with multiple conditions. Thanks to its photoresistor, it is able to detect the light intensity in day or at night, realizing a more intelligent and energy-saving system.
When the photoresistor detects that ambient brightness is lower than the set value, LED lights up. On the contrary, if the ambient light intensity is higher than the set value, photorisistor will send a different signal to turn off the LED.
Flow Diagram

Photoresistor
Description
A photoresistor, also called photosensor, converts light signal into electric signal (voltage, current, and resistor).
Working principle:
We place a photoresistor in a circuit in series connection and add suitable voltage to both poles. When there is no light, the resistance is infinite and the circuit almost opens. However, when there is light, the resistance decreases while the current increases, and it is equivalent to a short circuit when the light intensity is sufficient.
Now we will read the value of photoresistor by programming on ESP32 development board.

Schematic Diagram:
When light hits the photoresistor, the stronger the light is, the smaller the resistance will be, so the greater the VCC voltage will pass through the resistor.

Parameters:
Voltage: 3~5V
Current: 0.2mA
Power: 1mW
Spectrum Peak Value: 540nm
Bright Resistance (10lux): 5~10KR
Dark Resistance: 0.5MR
Wiring Diagram
Connect the photoresistor to io34.
Attention: Connect yellow to S(Signal), red to V(Power), and black to GND. Do not reverse them!

Test Code
Initialize the serial port.

Define a global variable “item” as the photoresistor value.

Set “item” to the read value and print it on serial monitor.

Complete code:

Test Result
Open the serial monitor.
The brighter the light detected by the photoresistor is, the greater the value will be.

Light Control System
Wiring Diagram
Connect the photoresistor to io34 and LED to io27.
Attention: Connect yellow to S(Signal), red to V(Power), and black to GND. Do not reverse them!

Test Code
Code Flow:

Determine:
The value of the photoresistor >= 800, LED turns off.
The value of the photoresistor =< 800, LED turns on.

Complete code:

Test Result
When the value of the photoresistor is greater than 800 (in daytime), LED goes off. However, if the value is less than 800, LED will automatically light on.

**Various conditions can adopt this type of system. Thanks to its photoresistor, it is able to detect the light intensity in day or at night, which saves energy and intellectualize the whole system. **
FAQ
Q: The value of the photoresistor cannot be 0.
A: In actual life, little light exists although you turn off all lights in your room, so the value of photoresistor only approaches to 0 rather than equals to 0.
Q: After uploading code, LED doesn’t light up even though the room is dark without lights.
A: Increase the determined value of photoresistor. In our example, we set to 800. So you may adjust it to 1000 or a greater value.
Project 3: Alarm System
In this project, we use a PIR motion sensor and a buzzer to consist an alarm system, which can be controlled by ESP32 development board.
How does it work? The electric signals are detected and read by the PIR motion sensor through programming on Arduino IDE, and then it determines whether there is a person. If there is, the buzzer alarms. In this way, this alarm system costs much lower for families and offices.
Flow Diagram

PIR Motion Sensor
Description
A PIR motion sensor detects the presence of a person by sensing the heat given off by the human body.
Moreover, this sensor is small and easy to use.

Schematic Diagram:

Parameters:
Voltage: 3~5V
Current: 3.6mA
Power: 18mW
Angle of View: Y = 90°, X = 110° (theoretical value)
Detection Distance: ≤5m
Wiring Diagram
Connect the PIR motion sensor to io23.
Attention: Connect yellow to S(Signal), red to V(Power), and black to GND. Do not reverse them!

Test Code
Read the value at pin IO23 to determine whether there is a human motion.

Test Result
Open the serial monotor.
When someone is in the area, Someone is displayed on the monitor, and the red LED on the sensor goes off. However, if there is no one, No one will be printed and the LED will always be on.
ATTENTION: PIR motion sensor is not able to penetrate things, so please do not cover the sensor while detecting motions.

Buzzer
Description
A buzzer is an electronic sounder, which emits sounds with different frequencies and durations and is powered by DC voltage. Thus, it can be used as a reminder or an alarm in considerable electronic devices, such as computers, printers, copiers, alarms, electronic toys, automotive electronics, telephones and timers.

A buzzer consists of vibration device and resonance device. And there are two categories: Passive buzzers and active buzzers.
A Passive Buzzer cannot
vibrateto emit sound itself, unless putting asquare wavesignal with a certain frequency. Moreover, the emitting sound varies due to the different frequency of square wave, so a passive buzzer can simulate tunes.An analog squire wave can be generated by changing the power level at pins. For example, after the high level lasting for 500ms, it shifts to a low level for another 500ms then to a high level again…
**We drive the buzzer via a squire wave within 200~5000Hz, and we can compute the frequency(f): f=1/T; T is the period (the total time of high and low level). **

An Active Buzzer is able to emit sound automatically without an external motivator, because it includes a driving circuit which only needs
DC power supply. However, its sound is flat with relatively fixed frequency.
In this experiment, a passive buzzer is applied to” play music”.
Schematic Diagram:

Parameters:
Voltage: 3~5V
Current: ≤5mA
Power: ≤25mW
Wiring Diagram
Connect the buzzer to io16.
Attention: Connect yellow to S(Signal), red to V(Power), and black to GND. Do not reverse them!

Test Code
Method 1: Analog Squire Wave
A passive buzzer is driven by squire waves, so we stimulate the wave.
An analog squire wave can be generated by changing the power level of pin: high level for 500us and low level for 500us. So, the buzzer will emit sound. Also, the durations can adjust the sound volume.
Please try 1000us, 1500us, 3000us…What’s the difference?

Code:

In delay function, the time unit us micro-seconds. So the following block represents a 500ms delay.

According to formula: $$ f=1/T $$ Thus, 500us is the duration, and we can calculate the frequency = 2kHz, i.e., the high and low level alter 2000 times per second.
Method 2: Speaker Blocks
We adopt Speaker code blocks to drive the buzzer to vibrate.
Speaker Blocks generates PWM signal with a certain frequency to drive the buzzer to vibrate, and the duration and tone is controlled by related parameters.
There are two ways to define the duration. One is to adjust the parameters of the tone() function to set a duration, and the other is to adopt a noTone() function to directly stop the sound. If you do not define a duration in tone(), the sound signal will always be generated unless a noTone() stops it.
For ESP32 board, one sound can only be produced at a time. If one pin of ESP32 is generating a sound signal via tone(), it is not acceptable to emit sound by this function on another pin.
Tone Table

Code:
Drag a “Tone” block from
as shown below, and set pin to IO16.
You may select a frequency at will.

No Tone: It is used to turn off all tones.

Complete code:

Test Result
Method 1: Buzzer keeps emitting sound.
Method 2: Buzzer alarms via tone() function.
Expansion: Play Music
Play music through tone().
Complete Code:

Alarm System
In this experiment, we will construct an alarm system by a PIR motion sensor, a buzzer and an LED. When the sensor detects a motion, buzzer emits sound and LED blinks to remind of an invasion.
Wiring Diagram
Connect the PIR motionsensor to io23, buzzer to io16, and LED to io27.
Attention: Connect yellow to S(Signal), red to V(Power), and black to GND. Do not reverse them!

Test Code
Code flow:

Complete code:

Test Result
Upload the code and the alarm system starts to work. When it detects a motion, buzzer alarms and LED blinks.
FAQ
Q: Tones of buzzer is not accurate with actual ones.
A: This regular buzzer just stimulates tones, so it is not able to meet professional requirements. If you want standard tones, a more specialized speaker is required.
Q: The PIR motion sensor misinforms results.
A: This PIR motion sensor is also not a professional one.
Please guarantee the following situations to avoid a misinformation:
Avoid objects blown by wind to flutter within the detection area, such as curtains, clothing and flowers.
Avoid strong light in the detection area, such as sunlight, car lights, spotlights and other light sources.
And so on…
Project 4: Rain Detection System
NOTE: Sprinkling water on sensors(except steam sensor) may cause a short circuit or modules to be out of work. If batteries get wet, even explosion may occur. Do be extra careful! For younger users, please operate with your parents. To guarantee security, please obey guidances and safety regulations.
In this project, we will create a rain detection system by a steam sensor. When rain is detected, ESP32 triggers various actions like sending message, activating sprinklers and turning on lights. Through this system, rainfall amount can be monitored, and water leakage can also be detected on roofs or in buildings.
Besides, it is easy to connect the steam sensor to ESP32 board, which forms a simple but effective rain detection system.

Flow Diagram

Steam Sensor
Description
Steam sensor detects the presence of water, so it is usually used in rain detection. If the rain hits the conductive pad on the sensor, it will send a signal to the Arduino board.

Schematic Diagram:

Parameters:
Voltage: 3~5V
Current: 1.5mA
Power: 7.5mW
Wiring Diagram
Connect the steam sensor to io35.
Attention: Connect yellow to S(Signal), red to V(Power), and black to GND. Do not reverse them!

Test Code
Initialize the serial port.

Read the sensor value at pin io35 and print it per second.

Complete code:

Test Result
Touch the detection area with a wet finger. The larger the area you touched is, the larger the value will be.
You may open the serial monitor to observe the currently detected value (range: 0~4095).

Rain Detection System
Description
When the steam sensor detects rain, it sends a signal to the board to trigger various actions, for instance, the buzzer alarms to remind that it is raining. This is especially useful for outdoor gardening and farming, enabling users to take necessary precautions to avoid over-watering.
Additionally, this system can be used to detect water leakage to prevent damage from water intrusion. Overall, the steam sensor is versatile and effective in various applications.
Wiring Diagram
Connect the steam sensor to io35 and buzzer to io16.
Attention: Connect yellow to S(Signal), red to V(Power), and black to GND. Do not reverse them!

Test Code
Code flow:

Code:
Initialize the serial port, and define a variable item as the received sensor value.

Receive the sensor value and print it on the serial monitor.

The received value detected by the sensor is within 800 ~ 1999:

The received value detected by the sensor is within 2000 ~ 2999:

The received value detected by the sensor is greater than 3000:

At the end of code blocks, add a “No Tone” to turn off the buzzer.

Complete code:

Test Result
The greater the detected value is, the loader the sound emitted by the buzzer will be.
FAQ
Q: Is the steam sensor waterproof?
A: The detection area can be exposed to water, but the wire junctions are not waterproof. During the experiment, please pay attention to the amount of water not to be too much to prevent short circuit.
Q: Although a long time has elapsed since the sensor detected water, the buzzer keeps buzzing.
A: It keeps buzzing because there are still blots of water in the detection area. Please just clean it up.
Project 5: Solar Power System

Description
Solar panel converts solar power into electricity for the LED. It is suitable for multiple applications, such as outdoor lighting, mobile devices charging, and back up power. Hence, you may establish a sophisticated and efficient solar power system according to your own needs.
Working Principle
How does solar panel convert solar power into electricity?

The solar panel absorbs light and directly or indirectly converts solar radiation into electricity. Compared with ordinary coal power generation, solar, wind and water power are more energy-saving and environment-friendly.
How does light convert to electricity?
Next, let’s talk about the conversion process from inside to outside in a solar panel .
The Sun emits energy in waves with a wide range of wavelengths, from ultraviolet to visible to infrared light.
Wavelength of Ultraviolet: 150~400nm;
Wavelength of Visible Light: 400~760nm;
Wavelength of Infrared Light: 760~4000nm;
The panel absorbs one of these ranges of wavelength and converts them into electricity. But how? Let’s move on.
The active part of most solar panel cell is made of a semiconductor — silicon(Si).

The conductivity of a semiconductor is between a conductor and an insulator in atmospheric temperature. Generally, it cannot conduct well, yet its conductivity improves in certain conditions.

The diagram above shows the internal structure of the semiconductor in solar cell, which is divided into three layers:
The top layer (red part) consists of Silicon(Si) and a little Phosphorus(P). The later carries more electrons than the former, providing sufficient electrons for the top layer. Due to these freely-moving electrons, this layer is conductive, so it is called Negative or N-type.
The middle layer (gray part) contains too few electrons to conduct.
The bottom layer (green part) mainly includes Silicon(Si) and Boron(B). The later carries less electrons than the former, so that a rarely few electrons move freely, causing the missing of electrons which are described as effective positive charge. Therefore, this layer is named Positive or P-type.

Usually, only the middle layer of the solar panel absorbs light waves with wavelength of 350~1140nm. According to the spectrum distribution in previous paragraphs, absorptions are long wave ultraviolet, short wave infrared and visible light.
The wavelength of ultraviolet is so short that they stops on the surface.

The wavelength of infrared light is too long too be absorbed by the panel, so they usually passes through or is reflected back.

The middle layer absorbs light and knocks electrons off from silicon in the top layer, leaving them in a free state, and empty electron holes are generated at the place where they were before.

The holes carries a positive charge. Meanwhile, free electrons move upwards to reach N-type layer, while holes move downwards to reach P-type layer.
In conclusion, electrons in the top and bottom layers are struck out after the middle layer absorbing solar energy. Therefore, N-type layer carries negative charge as a negative pole, while P-type layer is positively charged as a positive pole. In this case, as long as the two layers are connected, it conducts.
If sunlight shines on the solar panel, the above situation will last, and a large number of free electrons and holes will be produced. As our conclusion goes, electrons move upwards while holes move downwards, which forms the two poles and generates current.


Solar energy is an alternative energy source, which features sustainability and cost-effectiveness.
However, the electricity generated by one solar panel can be converted into several watts of power, which is enough for a calculator or a cellphone charger, yet not nearly enough to run a one-kilowatt toaster.
Solar power systems satisfy the needs of different users and benefit for environment as well. Combined with Arduino programming, this kind of system builds a variety of useful and efficient solar applications, like automatic lighting, chargers and smart homes.
Generally speaking, solar energy promises well for a wonderful and sustainable future.
Parameters
Voltage: 5V
Current: 80mA
Power: 400mW
Dimensions: 60*60mm
Test Result
Codes are not required in this project. Importantly, we learn about the new environmental energy — solar power.
When good illumination is provided, LED will light up in yellow. The brighter the light is, the brighter the LED will be.
FAQ
Q: Why does solar panel still work without sunlight?
A: It works with not only sunlight but also ambient light. The brighter the light is, the greater the voltage will be, and the lighter the LED will be.
Project 6: Smart Feeding System
In this project, the ultrasonic module detects whether animals are in the feeding area, and the Servo automatically opens the feeding box for fowls. Besides, incorporating IOT enables remote monitoring of such feeding systems which provides much convenience.
Overall, the automation and remote operation are optimizing the feeding process for this system.

Flow Diagram

Servo
Description
Servo, also called RC Servo Device, is a motor with a feedback. Commonly, Servo performs precise position control and outputs high torque, which most often appears in robotics projects, RC cars, airplanes and aircraft.

Internal Structure:

① Signal(S): It receives the control signal from microcontroller.
② Potentiometer: the feedback part of the Servo. It measures the position of output shaft.
③ Embedded board (Internal controller): the core of the Servo. It processes external control signal and the feedback signal of position and drives the Servo.
④ DC motor: the execution part. It outputs speed, torque and position.
⑤ Gear system: It scales the outputs from motor to the final output Angle ccording to a certain transmission ratio.
Drive the Servo:
Signal(S) receives PWM to control the output of Servo, and the position of output shaft directly relies on the duty cycle of PWM.
For instance:
If we send a signal with pulse width of 1.5ms to Servo, its shaft(horn) will revolves to the middle position(90°);
If pulse width =
0.5ms, the shaft turns to its minimum(0°);If pulse width =
2.5ms, the shaft turns to its maximum(180°).
NOTE: The maximum angle varies from the types of Servos. Some are 170° while some are only 90°. In spite of this, Servos usually will move a half (of the maximum) if they receive a signal with pulse width of 1.5ms.

The period of a Servo usually lasts 20ms and it produce pulses at a frequency of 50Hz. Most servos work normally at 40~200Hz.
Wiring Diagram
Connect the Servo to io26.
Attention: Connect yellow to S(Signal), red to V(Power), and black to GND. Do not reverse them!

Test Code
Initialize the serial port and define a variable item with an assignment of 80.

Set item to the angle of Servo from 80° to 180°, rotating 1° every 15ms.

Servo rotates 1° every 15ms, from 180° to 80°.

Complete code:

Test Result
The feeding box is slowly opened and then closed ,which is controllable.
NOTE: SG90 servo can rotate 180°. As the feeding box is small, 100° of rotation is enough to completely close the box.
80°: fully open
120°: half open
180°: close

ATTENTION
**Do not put your fingers into the box to avoid nipping! **
Do not block the door with something to avoid damaging servo!
Ultrasonic Sensor
Description

Schematic Diagram:

The frequency of sound waves that the human can hear is 20Hz ~ 20KHz, while ultrasonic waves are beyond that range.
Ultrasonic:

Ultrasonic module converts electricity and ultrasonic wave into each other by piezoelectric effect, and it also transmits and receives ultrasonic wave.
This kind of wave features directivity, strong penetration and easy concentration of sound energy.

In this ultrasonic ranging system, we firstly program on MCU(ESP32 development board) to generate an original square wave at 40KHz and drive the ultrasonic module to emit it. Immediately, the module calculates the distance to the object after receiving the reflected wave(Echo) amplified and shaped by the circuit. Herein, it records the duration of emission and reflection and calculates the distance according to the time difference.
Simply, MCU controls the module to emit ultrasonic wave which is bounced back after encountering obstacles and is received by the module. The time difference between them is an important factor in computing the distance (the speed of sound propagation in air is 340m/s).
Wiring Diagram
Connect the Echo of Ultrasonic module to io13 and Trig to io12.
Attention: Connect yellow to S(Signal) and red to V(Power). Do not reverse them!

Test Code
Set the correct pin: Trig to pin io12; Echo to pin io13.

Test Result
In this kit, the detection range is within 3~8cm.
Open the serial monitor, and observe.

Smart Feeding System
Description
The smart feeding system intelligently feeds domestic fowls via an ultrasonic module and a servo. The former detects the distance to animals while the later controls to open or close the feeding box. When a pet is detected close to the box, servo opens it to feed.
Wiring Diagram
Connect the Echo of Ultrasonic module to io13 and Trig to io12; connect the servo to io26.
Attention: Connect yellow to S(Signal), red to V(Power) and black to GND. Do not reverse them!

Test Code
Code Flow:

Code:
Initialize the serial port. Define a variable and assign it to 180.

Set the pin correctly, and print the received value.

Determine the detected distance value. If it is within 2cm ~ 7cm, the feeding box will open.

Complete code:

Test Result
When an animal is detected, open the feeding box.
ATTENTION
**Do not put your fingers into the box to avoid nipping! **
Do not block the door with something to avoid damaging servo!
FAQ
Q: Servo doesn’t work.
A: It may be stuck by itself or by wires when mount the bottom plate. before installing, please adjust the servo to 180° first. For how, please refer to the installation guidance.
Q: The detected distance is inaccurate.
A: When detecting, please measure from the transmitting head. Herein, this module is not a high-precision detector, so errors may exist.

Project 7: Temperature Control System
In this project, we will demonstrate how to use temperature and humidity sensor, fan and LCD1602 display to constitute an intelligent temperature and humidity control system.
The system measures ambient temperature and humidity and controls fan to cool down as needed. When the temperature exceeds the set threshold, the fan automatically turns on to reduce the ambient temperature below the set value. Meanwhile, the current temperature and humidity values will be displayed on LCD1602.
Therefore, it realizes automatic adjustment of ambient temperature and humidity, which is perfect for projects that require these functions.

Flow Diagram

Temperature and Humidity Sensor
Description
DHT11 temperature and humidity sensor outputs digital signals. It applies principles of analog signal acquisition and conversion as well as temperature and humidity sensing technology, so that it features long-term stability and high reliability. Besides, the sensor integrates a high-precision resistive humidity sensor and a resistive thermosensitive temperature sensor, and is connected with an 8-bit high-performance MCU.

DHT11 Communication Means:
DHT11 communicates through monobus(a single bus) which exchanges and controls data.
Monobus transmits Data Bit:
Data format of monobus: transmit 40bit data every time, and high-bit first.
8bit humidity integer value + 8bit humidity decimal value + 8bit temperature integer value + 8bit temperature decimal value + 8bit parity.
NOTE: Humidity decimal value equals 0.
Paraty Bit:
8bit humidity integer value + 8bit humidity decimal value + 8bit temperature integer value + 8bit temperature decimal value.
8bit parity equals the end 8 bits of the result.
Timing Diagram:

**NOTE: **
The host always reads the temperature and humidity values of last measurement from DHT11. Therefore, If the interval between two measurements is long, please consecutively detect twice and adopt the second result.
For more details, please visit ASAIR official website: http://www.aosong.com/products-21.html
Wiring Diagram
Connect the temperature and humidity sensor to io17.
Attention: Connect yellow to S(Signal), red to V(Power), and black to GND. Do not reverse them!

Test Code
Initialize the serial port and the sensor.

The serial monitor prints and refreshes humidity and temperature values per second.

Complete code:

Test Result

Open the serial monitor, and you will see the current temperature and humidity value.

LCD 1602 Module
Description
LCD 1602 possesses a standard 14-pin (without back light) or 16-pin (with back light) interface, saving the pins of MCU. Its display drives IC to realize I2C control.

I2C Serial Communication:
I2C communication, known fully as Inter-Integrated Circuit (IIC) or Two-Wire Interface (TWI), is a commonly-used dual-bus (a host and a slave) communication protocol, which is developed by Phillips Semiconductor (purchased by US NXP Semiconductors).
The biggest advantage is that only two wires complete the transmission of data, which largely simplifies circuits. In total, I2C bus can connect 127 nodes in parallel, so it supports multiple hosts and slaves.
Generally, external power supply is needless for slaves, as I2C bus will transmit the power to them:

I2C bus transmits data via 8-bit data transmission. Usually, one-byte-data is composed of nine clock signals, eight of which transmit data and the last one marks the end of transmission.
Moreover, I2C bus supports multi-byte data transmission by repeating the above process continuously.
I2C Protocol basically consists of:
Starting signal: Before transmission, sender transmits a starting signal to inform receiver of starting point.
Address: It notifies receiver to whom the data is being sent.
Data: It is transmitted one byte each time and bit by bit.
Ending Signal: When finishing transmission, sender ends data with an ending signal to inform receiver that process is over.
Timing Diagram of Serial Protocol:
For more details, please visit the official website: https://www.nxp.com/


We provide you with a library file Wire.h on Arduino for I2C protocol, in which functions can be directly called to communicate with I2C/TWI devices.
For details of library, please refer to:
https://www.arduino.cc/reference/en/language/functions/communication/wire/
Wiring Diagram
Connect the LCD to I2C BUS as shown below.
Attention: Connect yellow to S(Signal), red to V(Power), and black to GND. Do not reverse them!

Test Code
Initialize I2C address of LCD and turn on its back light.

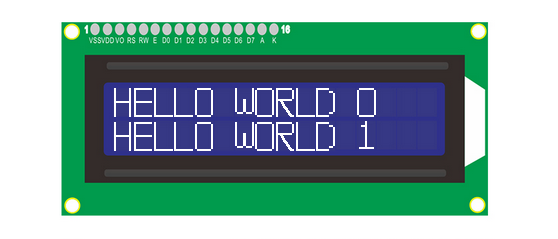
Set the LCD cursor position in X and Y axis (X-axis displays a maximum of 16 characters, and Y-axis displays a maximum of 2 columns).

Input the print content (No more than 16 characters, otherwise it will not be complete).

Complete code:

Test Result
LCD1602 opens its back light and displays ”HELLO WORLD 0“ and ”HELLO WORLD 1“.
Fan Module
Description
130 Motor is able to adjust speed via PWM. In the process, two pins are needed to be connected for controlling.
The module is suitable for multiple applications, such as computer heat dissipation and industrial production. What’s more it is compact and easy to install, which is very practical.

Schematic Diagram:

Wiring Diagram
Connect the motor to io18 and io19.
Attention: Connect yellow to S(Signal), red to V(Power), and black to GND. Do not reverse them!

Test Code
Set fan pin INA

Set the power level state of INA, which determines the rotation direction of fan.

Set fan pin INB.

Set the analog output at INB, which decides the rotation speed.
When INA is at high, the lower the analog output at INB is, the faster the fan will rotate.
When INA is at low, the greater the analog output at INB is, the faster the fan will rotate.

Test Result
130 motor alternatively rotates left and right every 2 seconds.

**NOTE: **
Intermittent stops exist during changing directions of rotation. They prevent an excessive current at the moment of reversal. Otherwise, a forced reset may occur due to insufficient power supply on the development board.
Temperature Control System
Description
Herein, we read the value of the DHT11 temperature and humidity sensor through monobus communication, and the values will be displayed on the LCD. If values exceed the set threshold, the fan will turn on for dehumidification and cooling to protect the animals and plants in the farm. Remarkably, this system is easy to install with multiple functions, such as speed controlling via PWM and data transmission by monobus.
Overall, it is a practical system that helps farmers monitor and control the real-time status to improve production efficiency.
Wiring Diagram
Connect the temperature and humidity sensor to io17.
Connect motor(fan) modue to io18 and io19
Connect LCD1602 to BUS I2C.
Attention: Connect yellow to S(Signal), red to V(Power), and black to GND. Do not reverse them!

Test Code
Code Flow:

Code:
Initialize LCD to set an address, and clear the display. Turn on its backlight and set cursor position:

Initialize the DHT11 sensor and choose a corresponding pin. Define two variables as temperature and humidity values.

In the loop, respectively assign the detected values to the two variables.

Display the values on LCD.

Determine the temperature and humidity value. if temperature is higher than 29° or humidity exceeds 80, fan will rotate.

Complete code:

Test Result
When the temperature reaches 29°C, the fan will turn on to dissipate heat. When it is lower than 29°C, the fan will turn off (the fan just simulates heat dissipation, so the effect is not good), which saves energy for the farm.
FAQ
Q: Is temperature and humidty sensor waterproof?
A: No. It detects the ambient temperature and humidity (in the air), so please do not put it in water.
Q: ESP32 board is reset when fan rotates.
A: When fan rotates, more current is required than other sensors, hence voltage and current may fluctuate in the circuit. Especially at the moment of fan reversal, fluctuations may be too heavy, resulting in a reset due to extremely low voltage and current in ESP32 development board.
Project 8: Soil Humidity Monitoring System
Pay attention! Do not overflow water from plastic pools in experiments. Spilling water on other sensors may cause not only a short circuit or modules to be out of work but also heat generation and even explosion. Do be extra careful! Especially for younger users, please operate with your parents. To guarantee security, please obey guidances and safety regulations.

Flow Diagram

Soil Humidity Sensor
Description
Soil humidity sensors are mainly used to measure water content in volumetric soil, monitor soil moisture, irrigate crops and protect forests. This kind of sensor is integrated in agricultural irrigation system to supply water regularly and efficiently, which optimize irrigation for a best plant growth.

Schematic Diagram:

Wiring Diagram
Connect the soil humidity sensor to io32.
Attention: Connect yellow to S(Signal), red to V(Power), and black to GND. Do not reverse them!

Test Code
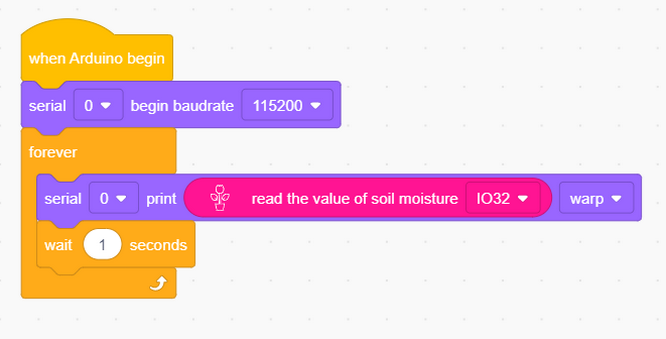
Initialize the serial port.

Print the read sensor value.

Complete code:
Test Result
Open the serial monitor.
Touch the detection area of the sensor with a wet finger and the currently detected humidity value will be printed on the monitor (range: 0~4095).

Soil Humidity Monitoring System
We adopt LCD1602 to reveal the real-time value of soil humidity value. When the value is lower than the set minimum humidity, the buzzer will emit sound to prompt farmers of irrigation.
Wiring Diagram
Connect the soil humidity sensor to io32.
Connect the buzzer to io16.
Connect the LCD1602 to BUS I2C.
Attention: Connect yellow to S(Signal), red to V(Power), and black to GND. Do not reverse them!

Test Code
Code Flow:

Code:
Initialize LCD and clear its display. Turn on the back light to observe the displayed value.

Initialize the serial port and define a variable.

Read the value of the soil humidity value and assign it to the variable. LCD shows the value.

Determine the read value. If it is lower than 200, the buzzer will alarm.

Complete code:

Test Result
When the value detected by the soil humidity sensor is lower than the set threshold, the buzzer emits sound to alarm.
FAQ
Q: Is soil humidity sensor waterproof?
A: With the exception of the detection area, the sensor is not waterproof. Spilling water on other area may result in a short circuit.
Project 9: Water Level Monitoring System
Pay attention! Do not overflow water from plastic pools in experiments. Spilling water on other sensors may cause not only a short circuit to disturb normal operations but also heat generation and even explosion. Do be extra careful! Especially for younger users, please operate with your parents. To guarantee security, please obey guidances and safety regulations.
Flow Diagram

Water Level Sensor
Description
The water level sensor is easy to use, portable and cost effective. It integrates a series of exposed parallel lines to measure the volume of water and droplets. Not only is the sensor smaller and smarter than other water detectors, but it also features:
Smooth transition between water volume and analog volume;
Strong flexibility. The sensor outputs basic analog values;
Low power consumption and high sensitivity;
Directly connect to microprocessors or circuits, and is suitable for various development boards and controllers, such as Arduino controllers, STC and AVR single-chip microcomputers.

Wiring Diagram
Connect the water level sensor to io33.
Attention: Connect yellow to S(Signal), red to V(Power), and black to GND. Do not reverse them!

Test Code

Test Result
Open the serial monitor.
Touch the detection area of the sensor with a wet finger and the currently detected value will be printed on the monitor (range: 0~4095).

Water Level Monitoring System
The water level monitoring system supervises the change of water level to clarify problems in time and take measures to avoid disasters. It is widely used in water conservancy projects, urban drainage and environmental monitoring.
Wiring Diagram
Connect the water level sensor to io33.
Connect the buzzer to io16.
Connect the LCD1602 to BUS I2C.
Attention: Connect yellow to S(Signal), red to V(Power), and black to GND. Do not reverse them!

Test Code
Code Flow:

Code:
Initialize the LCD and turn on its back light; clear all display and then print water level.

Define a variable as the detected water level.

Read the sensor value and display it on LCD.

Determine the water level value. If it is greater than 2000, the buzer will alarm.

Complete code:

Test Result
LCD displays the real-time value of water level. In the experiment, we cover the detection area with water to stimulate the water level. When the detected value exceeds the threshold, the buzzer starts to alarm.
FAQ
Q: Is water level sensor waterproof?
A: With the exception of the detection area, the sensor is not waterproof. Spilling water on other area may result in a short circuit.
Project 10: Auto-Irrigation System
Pay attention! Do not overflow water from plastic pools in experiments. Spilling water on other sensors may cause not only a short circuit to disturb normal operations but also heat generation and even explosion. Do be extra careful! Especially for younger users, please operate with your parents. To guarantee security, please obey guidances and safety regulations.
In this project, we stimulate irrigation via a water pump controlled by a relay module. Besides, we also determine whether there is water in the pool through water level sensor, and detect the soil humidity by soil humidity sensor. In this way, the system will be more intelligent in controlling the water pump.

Flow Diagram

Water Pumping System
Description
In this experiment, we use ESP32 development board to turn on/off the water pump by a relay module. A pump lifts water and transports liquids, and usually is combined with a relay module in usage.
Herein, we connect the relay module and the pump to the ESP32 board, and program to remotely turn on or off the pump through switching the state of relay. For how, we determine the state of relay according to the output value of the module or a preset time.
Relay Module:
In usage, it is often used in the management of high voltage and load current, say, motors, high-current sensors and high-power lights.

Normally Open (NO): This pin is normally open, unless a signal is received by the signal pin of the relay. Therefore, common pins are disconnected via NC pin and connected through NO pin.
Common Contact (COM): This pin connects to other modules, for example, water pump.
Water Pump:

Normally Closed (NC): NC pin is linked with COM pin to form a closed circuit. It uses ESP32 board to control the closure and the disconnection of the relay module.
Parameters:
Power voltage: 5V
Static current: 2mA
Maximum contact voltage: 250VAC/30VDC
Maximum current: 10A
Schematic Diagram:

Wiring Diagram
Attention: Connect yellow to S(Signal), red to V(Power), and black to GND. Do not reverse them!

Test Code

Test Result
After uploading code, the device will pump water once.
In this experiment, the water pump is automatized, reducing time and efforts of manual operation and improving efficiency. Therefore, this water pumping system is wildly used in agricultural production and water treatment.
Auto-Irrigation System
Description
In this experiment, we implement a smart irrigation system by a soil humidity sensor, a water level sensor, a relay module and a water pump. We connect the two sensors on ESP32 development board and program to read their output values to control the relay and water pump.
If the soil is very dry, the relay will turn on to control the water pump to irrigate plants; And if the water level is too low, the water pump will not be able to work, and the buzzer will alarm. In this way, plant watering and water level controlling are automatized, which raises production efficiency and reduces the time and efforts of manual operations.
Wiring Diagram
Connect the relay module to io25; connect its NC pin to the GND(black) at io2.
Water pump:
Connect the red wire to POWER 3V3 of the board
Connect the black wire(GND) to the COM pin of the relay
Connect the soil humidity sensor to io32
Connect the water level sensor to io33
Attention: Connect yellow to S(Signal), red to V(Power), and black to GND. Do not reverse them!

Test Code
Code Flow:

Code:
Initialize and clear the LCD, turn on the LCD back light. Define two variables as the detected sensor values.

Assign the two read sensor values to those variables.

Display these values on LCD.

If the water level value is lower than 700 or the soil humidity value is less than 1200, the buzzer will alarm.

When the soil humidity value is lower than 1200 but the water level value is greater than 700, the water pump will automatically irrigate the farm.

Complete code:

Test Result

LCD 1602 will display the current values of soil humidity and water level. When the detected humidity is lower than the set threshold, it implies that the soil is being arid, and irrigation starts automatically.
When the detected water level is lower than the set threshold, the water pumping system doesn’t work, and the buzzer alarms to notify that water is insufficient.
Press the button to stop alarming.
To sum up, we have achieved an analog auto-irrigation system in this project, which intelligently controls the on and off of the water pump according to the water level. In application, this system usually goes for household and agricultural production.
FAQ
Q: Are the modules waterproof?
A: The relay module is not, yet the water pump is. The waterproof grade of the water pump is IP68.
Q: ESP32 board is reset when the water pump works.
A: When water pump works, more current is required than other modules, hence voltage and current may fluctuate in the circuit. Sometimes fluctuations may be too heavy, resulting in a reset due to extremely low voltage and current in ESP32 development board.
When operating the water pump, please follow the example code:
Q: Fail to pump water?
A: Several pumping operations are required to fill the water pump before using it. These initial pumpings do not actually draw the water, but to introduce sufficient water into the pump. Only after the pump is full can water be carried out. So we are first for filling, not pumping.
Project 11: WIFI Control Smart Farm
Pay attention! Do not overflow water from plastic pools in experiments. Spilling water on other sensors may cause a short circuit or modules to be out of work. If batteries get wet, even explosion may occur. Do be extra careful! For younger users, please operate with your parents. To guarantee security, please obey guidances and safety regulations.

Flow Diagram

WIFI Web Page Display
Description
ESP32 board is equipped with Wi-Fi(2.4G) and Bluetooth(4.2), which enable it to easily connect to WiFi and communicate with other devices on the network. What’s more, web pages can be displayed in browsers via ESP32.

Arduino IDE provides you wih library file <WiFi.h>, which support Wi-Fi configurations and ESP32 Wi-Fi networking monitoring.
Base station mode (STA or Wi-Fi client-side mode): In this mode, ESP32 connects to the Wi-Fi hotspot (AP).
AP mode (Soft-AP or Wi-Fi hotspot mode): In this mode, other Wi-Fi devices connect to ESP32.
AP-STA mode: In this mode, ESP32 is a Wi-Fi hotspot as well as a Wi-Fi device connecting to another Wi-Fi hotspot.
These modes is compatible with multiple safe modes, like WPA, WPA2 and WEP.
It is able to scan for Wi-Fi hotspot, including active and passive scan.
It supports promiscuous mode to monitor IEEE802.11 Wi-Fi Packets.
For wifi details, please refer to:
https://docs.espressif.com/projects/esp-idf/en/latest/esp32/api-reference/network/esp_wifi.html
ESPRESSIF official website: https://www.espressif.com.cn/en/home

Import Library
Click

Click
 to choose “Web Page Editing PRO”, and libraries will be loaded.
Test Code
Connect to the WiFi hotspot, input your SSID and password.

Display IP address on LCD

Define a web page components named temperature (unit: ℃)


Add a button named “button”


Complete code:

Visit the Website
Once connected to WiFi, you can use the ESP32’s web server library to serve web pages. In the following example, we will create a simple web page to display a fixed temperature information:
Last but not least, you may open the IP address in browser to visit the web page. In our example code, please input “http://[IP address of ESP32]” to visit the website.
NOTE: When PC, mobile phones and ESP32 board are connected to one network, you can visit this website at PC and phones at the same time.
Here is the ESP32 IP address of your own.
PC:

Mobile phone:

WIFI Control Smart Farm
Code Flow

Upload the code.
SSID and PASSWORD are needed to modify to your wifi name and password:
Complete Code

Result
PC:

Mobile Phone:

Input the IP address in browsers at mobile phones or PC, you can check the sensor values and control the LED and fan.
Sensor Values |
Controllable Devices |
|---|---|
Temperature (℃) |
LED |
Humidity (%rh) |
Fan |
Water level (%) |
Feeding box |
Rainfall (%) |
Water pump |
Brightness (0~4095) |
|
Soil humidity (%) |
With the ESP32 development board, we have learned how to create a web page to display the sensor values, like temperature, humidity, water level and soil humidity, and we can also control LED lights, fans, feeding boxes and pumps. Moreover, these operations can be remotely finished through mobile phones or computers.

In this project, we stimulate a smart farm with intelligent and remote management. Such technology facilitates the control of equipments and improves agricultural efficiency and quality, which make Internet of Things, informatization, automation and intelligence possible.
FAQ
Q: Wifi always fails to be connected.
A: Move ESP32 to the side of the router and reboot the board, and just be patient to wait. If it still fails to connected, please check whether the WiFi name and password are correct.
Q: The response is slow during remote opterations on web page.
A: Possible reasons:
The router CPU resources are insufficient due to multiple connections. Please reboot the router to try a reconnection.
The router works for a long time. Please reboot the router.
Wireless interference. Wireless signal is unstable, so please do not use it through the wall.
For knowledge of routers, please Google by yourself.
Q: Fail to pump water?
A: Several pumping operations are required to fill the water pump before using it. These initial pumpings do not actually draw the water, but to introduce sufficient water into the pump. Only after the pump is full can water be carried out. So we are first for filling, not pumping.
Project 12: APP Control Smart Farm
Pay attention! Do not overflow water from plastic pools in experiments. Spilling water on other sensors may cause a short circuit or modules to be out of work. If batteries get wet, even explosion may occur. Do be extra careful! For younger users, please operate with your parents. To guarantee security, please obey guidances and safety regulations.

Description
The APP management system is able to monitor multiple real-time index of the farm, such as temperature and humidity, pool water level, soil humidity, light intensity and rainfall.
Meanwhile, it also controls LED for lighting, water pump for irrigation, feeding box for feeding and fan for adjusting temperature and humidity.

These functions can be realized via an APP on your phone, facilitating farm management. For more intelligence, a buzzer also adopted as an alarm.
Flow Diagram

Test Code
Code Flow

Burn Code on ESP32
Connect ESP32 to WiFi. In the following code, ssid and pwd are respectively WiFi name and password
LCD displays IP address
Initialize wifi server. After initialization, ESP32 and APP can communicate with each other through WIFI.

Check whether wifi is connected to client/APP

Send real time data of sensors to APP:

ESP32 receives data from APP and determine them. NOTE: All data are in the format of String.

Complete Code

APP
APP Download

Android:
Open Google play, and search IOT farm to download.

In provided files, Android apk installing package is included:

IOS:
Search IOT farm in APP Store and tap to download.
APP Interface

APP Function Description
When your phone and ESP32 board connect to the same WIFI, you only need to input IP address at upper-right conner to link them.

Displays the temperature value of the farm in real time.

Displays the humidity value of the farm in real time.

Displays the soil humidity value of the farm in real time.

Displays the sun brightness value of the farm in real time.

Displays the water level of the farm in real time.

Displays the analog rainfall value of the farm in real time.

Control LED.

Control irrigation via water pump.

Control the fan to adjust temperature.

Control servo to open or close feeding box.

Control buzzer to play music.

FAQ
Q: Wifi always fails to be connected.
A: Move ESP32 to the side of the router and reboot the board, and just be patient to wait. If it still fails to connected, please check whether the WiFi name and password are correct.
Q: APP fails to connect to ESP32.
A: Please make sure that APP and ESP32 are connected to the same WiFi.
Q: Fail to pump water?
A: Several pumping operations are required to fill the water pump before using it. These initial pumpings do not actually draw the water, but to introduce sufficient water into the pump. Only after the pump is full can water be carried out. So we are first for filling, not pumping.
FAQ
Q: What type of batteries should this kit be equipped with?
A: Six AA batteries, each one with the diameter of 14MM and height of 49MM. Please install batteries in a correct way and do not reverse them! For younger learners, please operate under the accompaniment of parents.
Q: An error occurs when burning programs on ESP32 mainboard.
A:
Please check whether the COM port is correct.
Please check whether the selected board is correct.
Q: Can this kit expands to other modules?
A: Yes. When expanding to other modules, please check pin description to make sure that ESP32 pins work normally.
Q: An error occurs when importing <Wire.h> library.
A: When installing ESP32 development board on arduino IDE, <Wire.h> library will be imported automatically, so you don’t need to add it repeatedly.
Resources
Keyestudio official website:
Keyestudio wiki main page:
https://wiki.keyestudio.com/Main_Page
ESP32 development board:
https://wiki.keyestudio.com/KS5016_Keyestudio_ESP32_PLUS_Development_Board
Arduino official website:
ESP32 espressif official website: