4.3.4 Smart Noise Tester
4.3.4.1 Overview

The smart noise tester, also known as the sound level meter or decibel meter, is used to detect noise. Noise is classified into different levels, and the microphone on the micro:bit will detect its intensity in the environment in real time. According to the levels, micro:bit divides it into several grades.
In this project, the OLED display will show the current noise level in real time, and the 5×5LED matrix will light up/turn off some LED according to the noise level.
This kind of device has significantly lowered the technical threshold and cost of noise monitoring, so is widely applied to environment noise monitoring, occupational health and safety, construction sites, and entertainment venues, etc.

4.3.4.2 Component Knowledge

Microbit Microphone
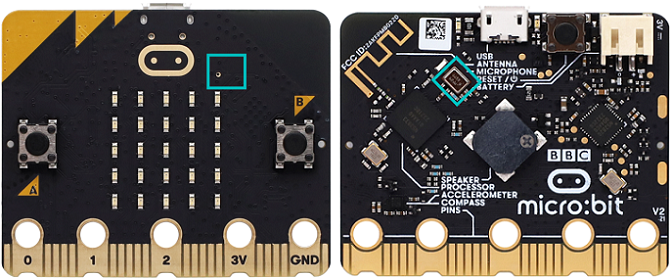
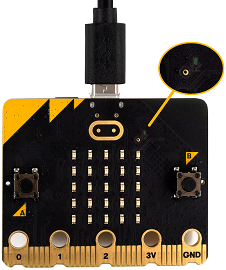
The micro:bit V2 board is built with a microphone which detects sounds and audio signals. The microphone is placed on the top of the board (the small hole, which is used for picking up ambient sound signals, and an LED indicator is next to the hole). The chip that controls and handles the microphone is located on the back of the board.
When using, simply place the micro:bit board face up.
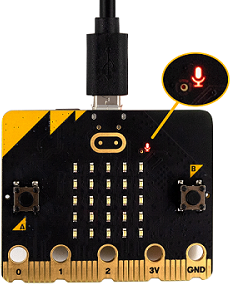
When the board detects sound, the microphone LED indicator lights up.

4.3.4.3 Required Components
|
|
|
|---|---|---|
micro:bit V2 main board ×1 |
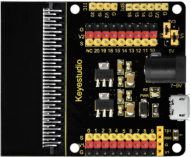
micro:bit shield ×1 |
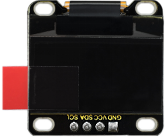
OLED display ×1 |
|
|
|
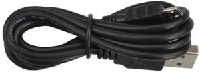
micro USB cable ×1 |
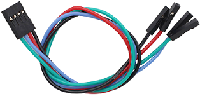
4 pin wire ×1 |
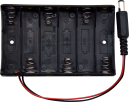
battery holder ×1 |
|
||
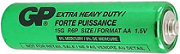
AA battery(self-prepared) ×6 |
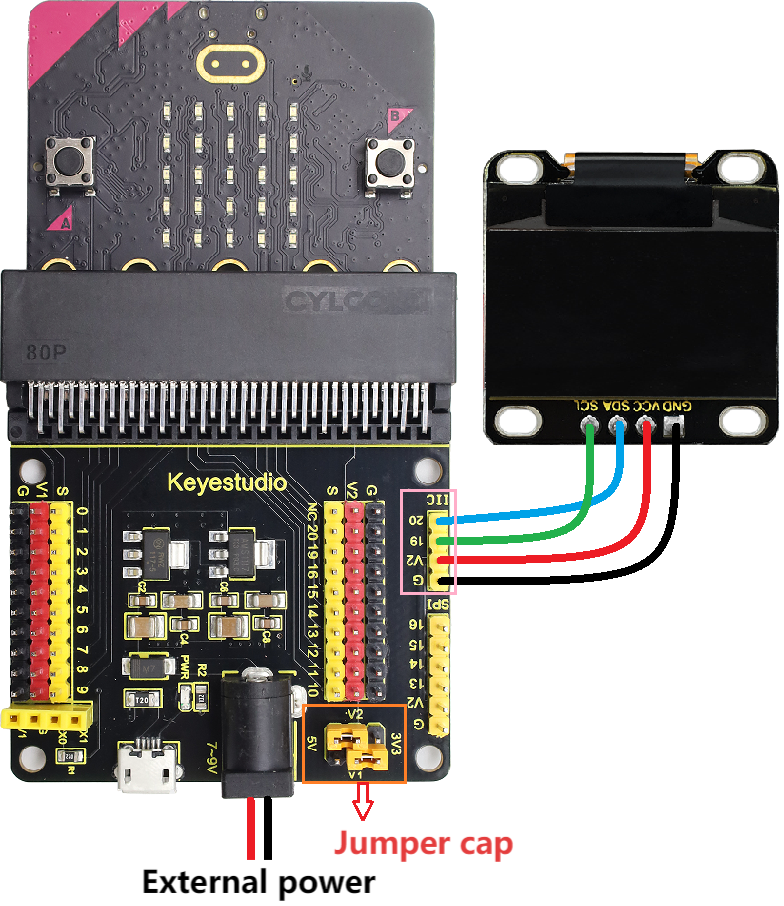
4.3.4.4 Wiring Diagram
⚠️ When wiring, please pay attention to the wire color.
OLED display |
wire color |
micro:bit shield pin |
micro:bit board pin |
|---|---|---|---|
GND |
black |
G |
G |
VCC |
red |
V2 |
V |
SDA |
blue |
20 |
P20 |
SCL |
green |
19 |
P19 |
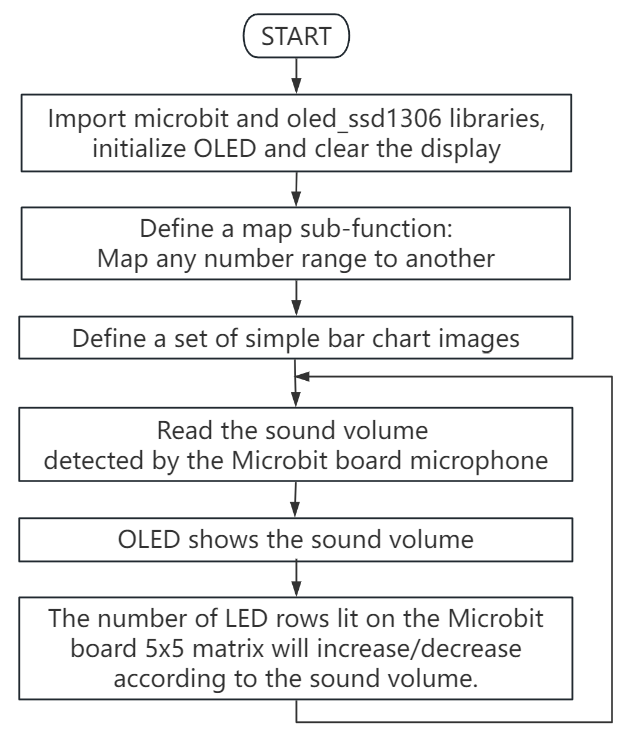
4.3.4.5 Code Flow
4.3.4.6 Test Code
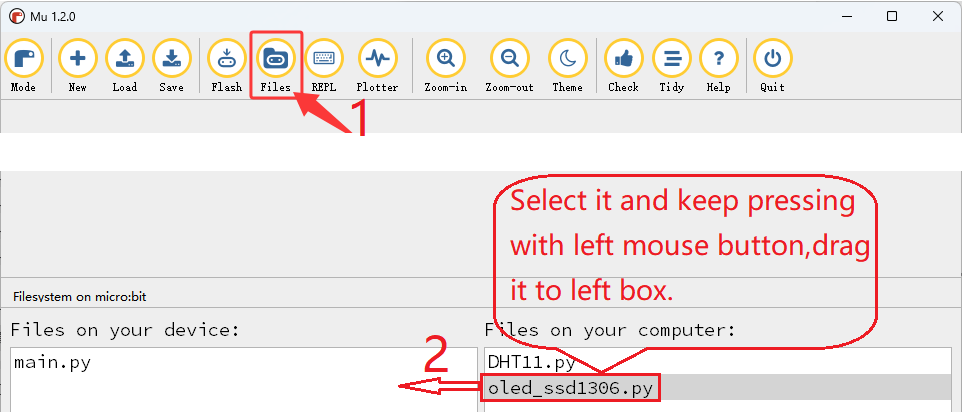
⚠️ Tip 1: Before downloading the code to the Microbit board, please import the library file “oled_ssd1306.py” refering to “Import Library on MU” .
Complete code:
# import related libraries
from microbit import *
from oled_ssd1306 import *

# initialize and clear oled
initialize()  # initialize oled
clear_oled()  # clear oled

# function to map any range of numbers to another range
def map(value, fromMin, fromMax, toMin, toMax):
    fromRange = fromMax - fromMin
    toRange = toMax - toMin
    valueScaled = float(value - fromMin) / float(fromRange)
    return toMin + (valueScaled * toRange)

# set of images for simple bar chart
graph5 = Image("99999:""99999:""99999:""99999:""99999")
graph4 = Image("00000:""99999:""99999:""99999:""99999")
graph3 = Image("00000:""00000:""99999:""99999:""99999")
graph2 = Image("00000:""00000:""00000:""99999:""99999")
graph1 = Image("00000:""00000:""00000:""00000:""99999")
graph0 = Image("00000:""00000:""00000:""00000:""00000")

allGraphs = [graph0, graph1, graph2, graph3, graph4, graph5]

# ignore first sound level reading
# soundLevel = microphone.sound_level()
# sleep(100)

while True:
    # map sound levels from range 0-255 to range 0-5 for choosing graph image
    soundLevel = int(map(microphone.sound_level(), 0, 255, 0, 5))
    display.show(allGraphs[soundLevel])
    clear_oled() # clear OLED
    add_text(0, 0, "Acoustic Sound Level:")  # Display the character string in the corresponding position of OLED
    add_text(0, 2, str(microphone.sound_level()))  # Display soundLevel in the corresponding position of OLED
    sleep(200)

Brief explanation:
① Import libraries of microbit and oled_ssd1306.
from microbit import *
from oled_ssd1306 import *
② Initialize OLED pixels, clear the OLED.
initialize()  # initialize oled
clear_oled()  # clear oled
③ Define a map sub-function (to map any number range to another).
def map(value, fromMin, fromMax, toMin, toMax):
    fromRange = fromMax - fromMin
    toRange = toMax - toMin
    valueScaled = float(value - fromMin) / float(fromRange)
    return toMin + (valueScaled * toRange)
④ Define a set of simple bar graph images.
graph5 = Image("99999:""99999:""99999:""99999:""99999")
graph4 = Image("00000:""99999:""99999:""99999:""99999")
graph3 = Image("00000:""00000:""99999:""99999:""99999")
graph2 = Image("00000:""00000:""00000:""99999:""99999")
graph1 = Image("00000:""00000:""00000:""00000:""99999")
graph0 = Image("00000:""00000:""00000:""00000:""00000")

allGraphs = [graph0, graph1, graph2, graph3, graph4, graph5]
⑤ Map the sound value range of 0-255 to 0-5 of the selected graphic image.
soundLevel = int(map(microphone.sound_level(), 0, 255, 0, 5))
display.show(allGraphs[soundLevel])
⑥ Read the detected value and display it on the OLED.
clear_oled() # clear OLED
add_text(0, 0, "Acoustic Sound Level:")  # Display the character string in the corresponding position of OLED
add_text(0, 2, str(microphone.sound_level()))  # Display soundLevel in the corresponding position of OLED
sleep(200)
4.3.4.7 Test Result

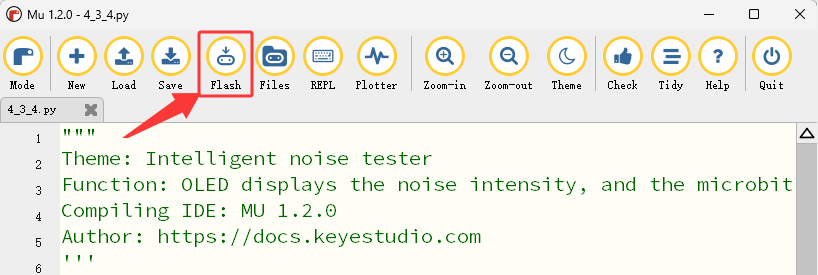
After wiring up and power on by micro USB cable, connect to external power(6 AA batteries) to ensure sufficient power supply, and click “Flash” to download the code to micro:bit board.
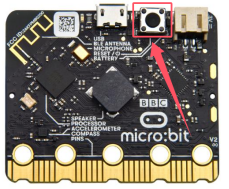
After uploading test code, press the reset button on the back of micro:bit.
Blow air (or make a very loud noise) into the microphone on the Microbit board (⚠️ special reminder: Blowing air has a more obvious effect), and the OLED display will show real-time information related to air blowing (or noise) intensity, allowing users to intuitively understand the intensity of the air blowing (or noise). Meanwhile, the 5×5LED dot matrix screen on the Microbit board will gradually increase or decrease the number of rows of LED lights on the screen according to the intensity of the air blowing (or noise), achieving the effect of reminding the intensity of the air blowing (or noise)
⚠️ Note: The building blocks in the experiment are not included in this kit.
(Tip: If no result is observed, please press the reset button of the micro:bit board.)
